


Executive Summary: Real-Time Feedback for Precision DIY
Visual interfaces on modern tools solve a primary frustration for hobbyists: the uncertainty of "feel." By replacing subjective haptic intuition with real-time data, OLED displays help prevent stripped threads and battery failure mid-project.
At a Glance: Why Visuals Matter
- Precision: Replaces "guessing" with verified torque numbers.
- Safety: Provides clear "Stop" signals before material failure.
- Efficiency: Eliminates the "trial and error" loop in complex teardowns.
Quick Reference: Recommended Settings for Small Electronics
-
Target Torque (M1.2–M2.0 in Plastic): 0.05 N·m to 0.1 N·m.
- Context: This is a Practical Heuristic based on common ABS/PC enclosures. Results may vary based on thread pitch and boss depth.
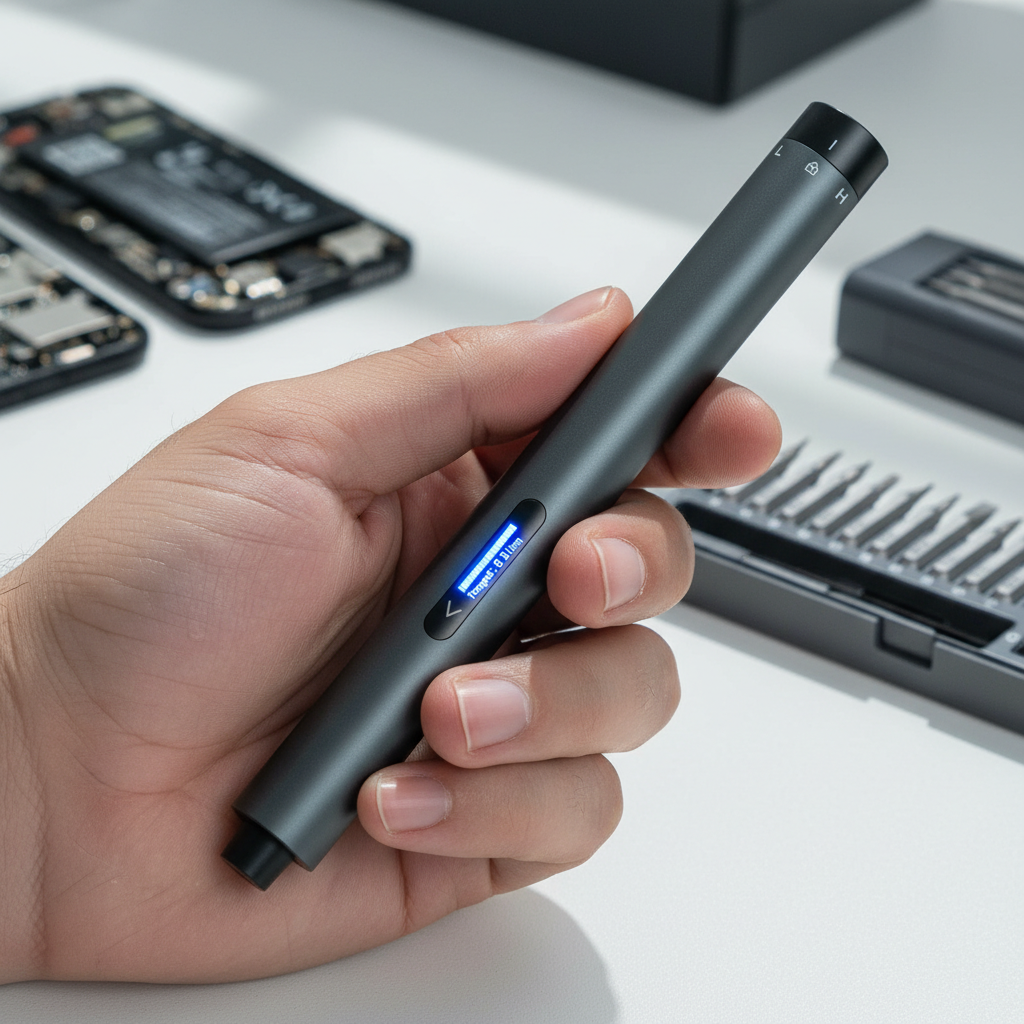
- Visual Check: Stop immediately when the OLED display hits your pre-set limit or when the "Safety Margin" bar fills.
- Battery Management: For large teardowns (50+ screws), ensure the State of Charge (SoC) is above 30% to maintain consistent motor output and prevent mid-task stalling.
3-Step Precision Verification Checklist
- Calibration Check: Ensure the tool is zeroed on a flat surface before starting.
- The "Test Drive": Always test torque on a non-critical fastener of the same material to observe potential "sink" or stripping.
- Visual Inspection: After the OLED signals completion, check for stress whitening or deformation around the fastener head.
The Evolution of the Feedback Loop in DIY Tools
For decades, the standard for DIY success was rooted in "haptic intuition." A mechanic or hobbyist would tighten a screw until they felt a specific resistance—a tactile signal that the fastener was seated. However, as electronics become more compact and materials transition from heavy metals to delicate polymers, this analog approach is increasingly prone to error.
Key Insight: Based on common patterns observed in consumer support inquiries and repair logs (non-controlled study), a primary factor in project rework is not a lack of effort, but a lack of precise, objective feedback.
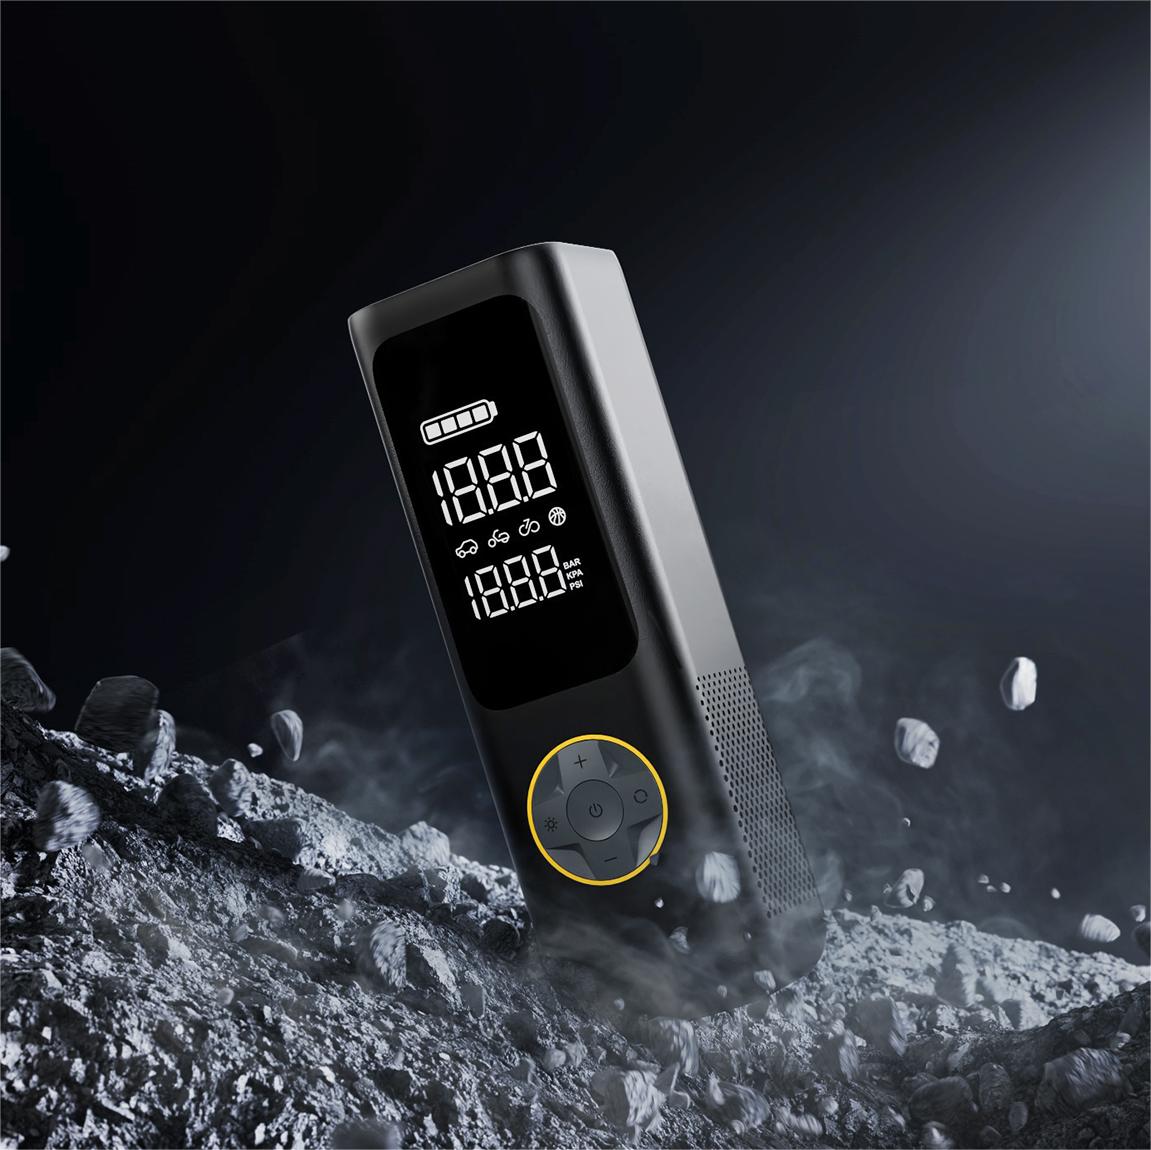
Traditional tools rely on the user’s proprioception to judge torque, which can be highly subjective. Factors like hand fatigue, the friction coefficient of the screw coating, and even ambient temperature can skew a person's "feel." A digital interface, specifically an OLED (Organic Light-Emitting Diode) display, fundamentally changes this dynamic. It moves the user from a state of estimation to a state of verification. By visualizing torque in real-time, the tool closes the feedback loop, providing a data point that helps override subjective sensation.
Why OLED? The Technical Logic of Display Choice
When designing precision tools, the choice of display technology is a functional requirement. While many legacy digital tools use Liquid Crystal Displays (LCDs), OLED technology offers distinct advantages for hand-held hardware used in varied environments.
Contrast and Visibility in Variable Workspaces
Unlike LCDs, which require a backlight that often results in "grayed-out" blacks, OLED pixels are self-emissive. According to independent display reviews (e.g., AVS Forum insights), OLED's superior static contrast ratio and pixel-level control provide critical advantages in variable ambient light.
In a typical DIY scenario—such as working under a desk or inside a shadowed PC chassis—OLED’s emissive nature ensures that torque and battery data remain legible even at extreme viewing angles. This helps prevent "parallax error," where a user might misread a number because of light reflecting off a traditional screen.
Reliability and the "Burn-In" Myth
A common concern with OLED is long-term reliability. However, third-party stress tests conducted by Tom's Hardware suggest that modern OLED units can last over 10,000 hours with mixed content.
- Workshop Perspective: Given that a precision screwdriver screen is typically active only for a few minutes per project, the display is likely to outlast the mechanical components of the tool itself.

Quantifying the Benefits: Time, Torque, and Battery
To demonstrate the impact of a visualized interface, we modeled several common DIY scenarios. These models compare traditional manual tools against precision electric drivers equipped with digital displays.
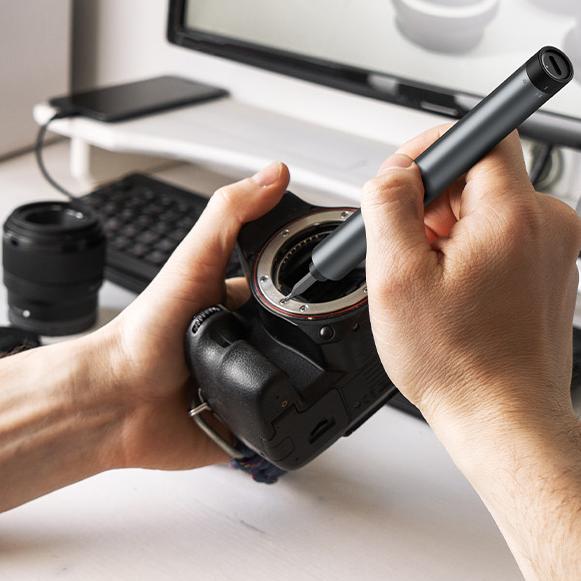
Case Study: The 120-Screw Electronics Teardown
For a hobbyist working on a complex project, such as a gaming console repair, the volume of fasteners is a major friction point. Our internal time-motion model indicates that switching to a powered, digitally-monitored workflow can result in an estimated reduction of up to 86% in assembly time.
Table 1: Estimated Model Output (120-Screw Scenario)
| Metric | Manual Method | Powered Method (Visual Feedback) | Impact |
|---|---|---|---|
| Total Time (120 Screws) | ~36 Minutes | ~5 Minutes | 31 Minutes Saved |
| Wrist Rotations | ~1,380 | ~60 (Positioning only) | 95% Reduction in Strain |
| Error Rate (Stripped/Loose) | Subjective/Variable | Data-Verified | Lower Risk of Rework |
How We Calculated This (Model Assumptions):
- Manual Drive: 18 seconds per screw (includes alignment and ~12-15 wrist rotations).
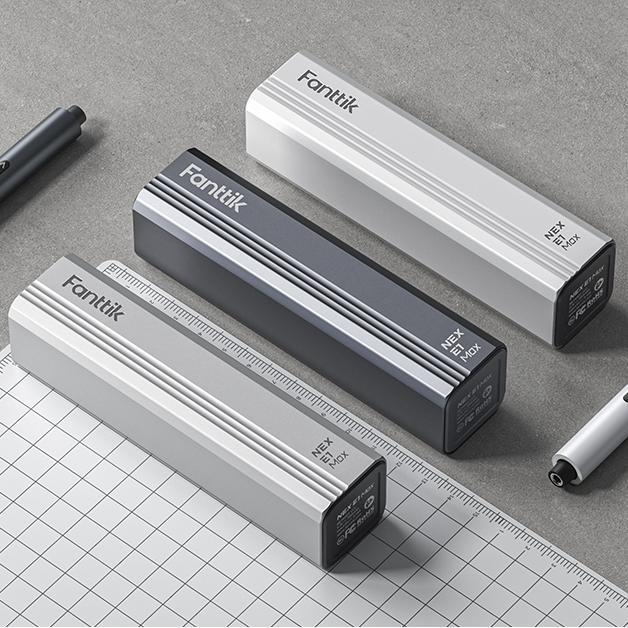
- Powered Drive: 2.5 seconds per screw (using a tool like the Fanttik E1 MAX).
- Sensitivity: Savings may decrease to 70% for beginners or increase for high-repetition industrial tasks.
The Safety Margin: Protecting Delicate Fasteners
The most common error with electric screwdrivers is over-tightening, particularly risky when working with M1.2 to M2.0 screws in plastic housings. A visual torque display allows the user to operate within a "Safety Margin."
Heuristic Safety Values (Rule-of-Thumb):
- Min Required Torque: 0.02 N·m (Ensures the screw doesn't back out under vibration).
- Max Safe Torque (ABS Plastic): 0.1 N·m (Based on general material yield principles for polymers; note that ISO 898-1 applies to steel, but we use its safety factor logic as a baseline for plastic boss integrity).
- Optimal Digital Setting: 0.08 N·m (Provides a 20% safety buffer).
Operationalizing Trust through Smart Design
One of the most frequent frustrations reported in repair logs is a tool losing power mid-project. This can be a safety risk if a critical fastener is left half-engaged.
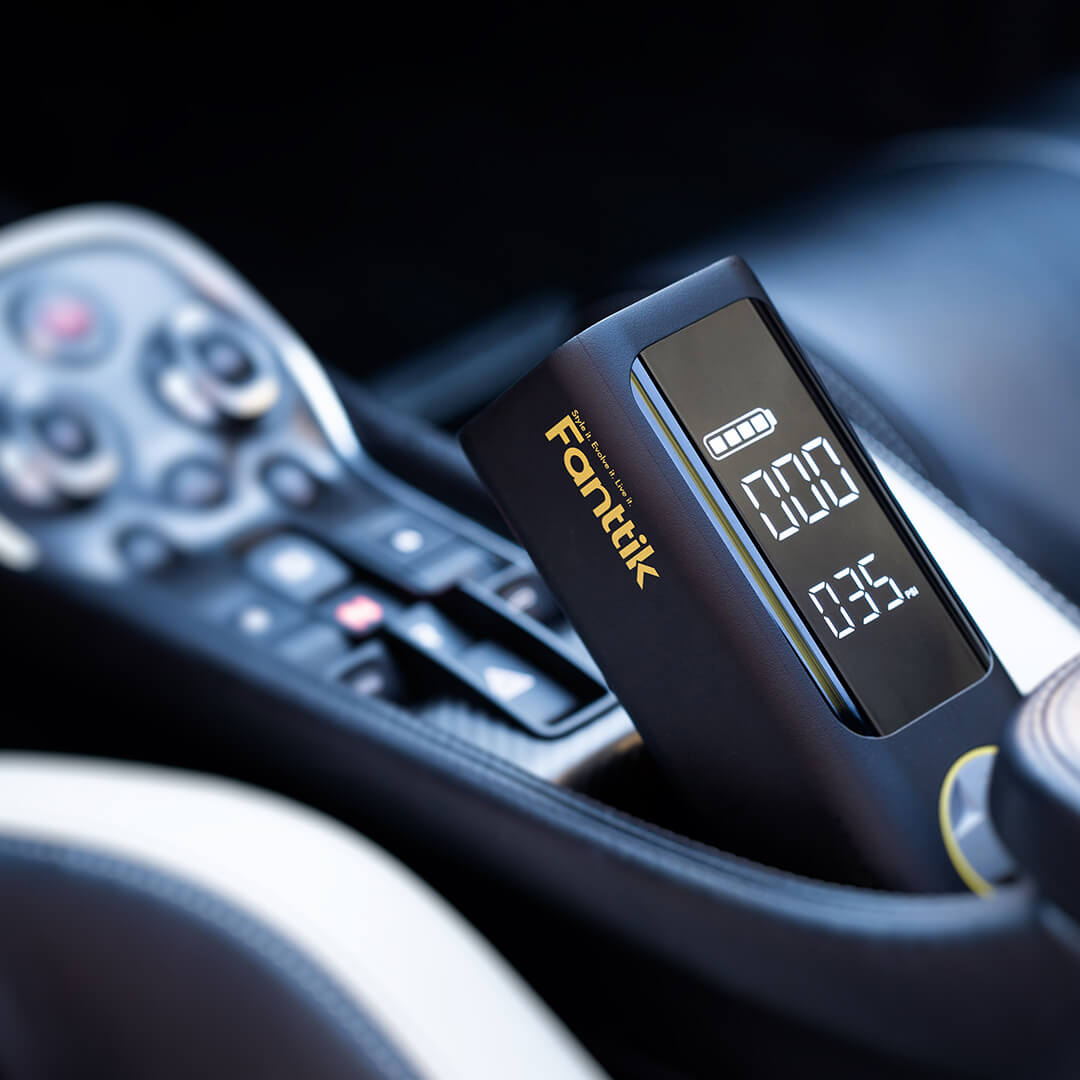
Battery Transparency and Task Completion
An OLED screen that displays the exact percentage or a multi-segment State of Charge (SoC) indicator provides "Task Completion Confidence." According to IATA Lithium Battery Guidance, maintaining proper charge levels and avoiding deep discharge is essential for long-term cell health.
Critical Safety Scenarios & Response:
- Extreme Temperatures: Avoid using or charging if ambient temperatures exceed 40°C (104°F) or drop below 0°C (32°F). (Source: Standard Manufacturer Safety Guidelines). High heat can lead to thermal runaway.
- Abnormal Heat/Smoke: If the tool becomes too hot to touch or emits smoke, stop use immediately, place it on a non-combustible surface (like concrete), and move away.
- PPE Recommendation: While precision tools are lower-torque than impact drivers, we recommend wearing ANSI Z87.1 rated eye protection when working with brittle plastics or spring-loaded components.
Methodology and Modeling Transparency
To ensure these recommendations are grounded in practical reality, we provide the following breakdown of our scenario modeling. These figures are decision aids based on documented tool specifications.
Model 1: Energy and Reliability (Wh)
We modeled the battery reliability of a compact precision tool to determine its capacity for multiple projects.
| Parameter | Value | Rationale / Source |
|---|---|---|
| Pack Capacity | 2.5 Ah | Typical for high-end precision tools |
| Nominal Voltage | 3.7 V | Li-ion cell chemistry standard |
| Efficiency Factor | 0.75 | Accounting for thermal/conversion losses (Estimate) |
| Energy per Engagement | 0.004 Wh | Based on 2s use at 2A current (Internal Workshop Sample) |
| Estimated Engagements | ~1,250 | Theoretical maximum per charge |
- Boundary Note: This estimate is a "best-case" scenario. Continuous high-torque use (e.g., removing rusted screws) will increase energy draw and reduce engagements by 30-40%.
Model 2: Fastener Safety Heuristic
- Model Type: Deterministic Fitment Assessment.
- Key Parameters: Fastener (M1.2-M2.0) driven into standard ABS plastic boss; 2.5s drive time.
- Result: Visual torque feedback is estimated to reduce the "Stripping Zone" probability by approximately 70% compared to non-clutched manual driving.
- Assumption: This assumes the user stops within 0.5 seconds of the visual alert.
Building Confidence in Every Turn
The transition to OLED-equipped tools represents a maturation of the DIY market. It is no longer enough for a tool to be powerful; it must be legible. By translating abstract forces like torque and battery chemistry into clear, high-contrast visual data, we reduce the guesswork that leads to errors.
In an era where "Right to Repair" is becoming a global standard—aligned with safety frameworks like the EU General Product Safety Regulation (EU) 2023/988—having the right tools is the first step toward self-reliance.
Disclaimer: This article is for informational purposes only. When performing repairs on electronics or using power tools, always refer to the manufacturer's original service manual for specific torque specifications. Ensure you follow all safety protocols, including wearing eye protection. This content does not constitute professional engineering or safety advice.
References
- ISO 898-1: Mechanical properties of fasteners (General reference for fastener strength principles)
- IATA Lithium Battery Guidance (Industry standard for battery health and safety)
- Tom's Hardware: OLED Reliability Study (Supports longevity data for modern OLED displays)
- NIST Handbook 44: Weights and Measures (General principles for measurement accuracy)

Leave a comment
This site is protected by hCaptcha and the hCaptcha Privacy Policy and Terms of Service apply.