


The Midday Roadside Paradox: Why Your Inflator "Lies" in the Sun
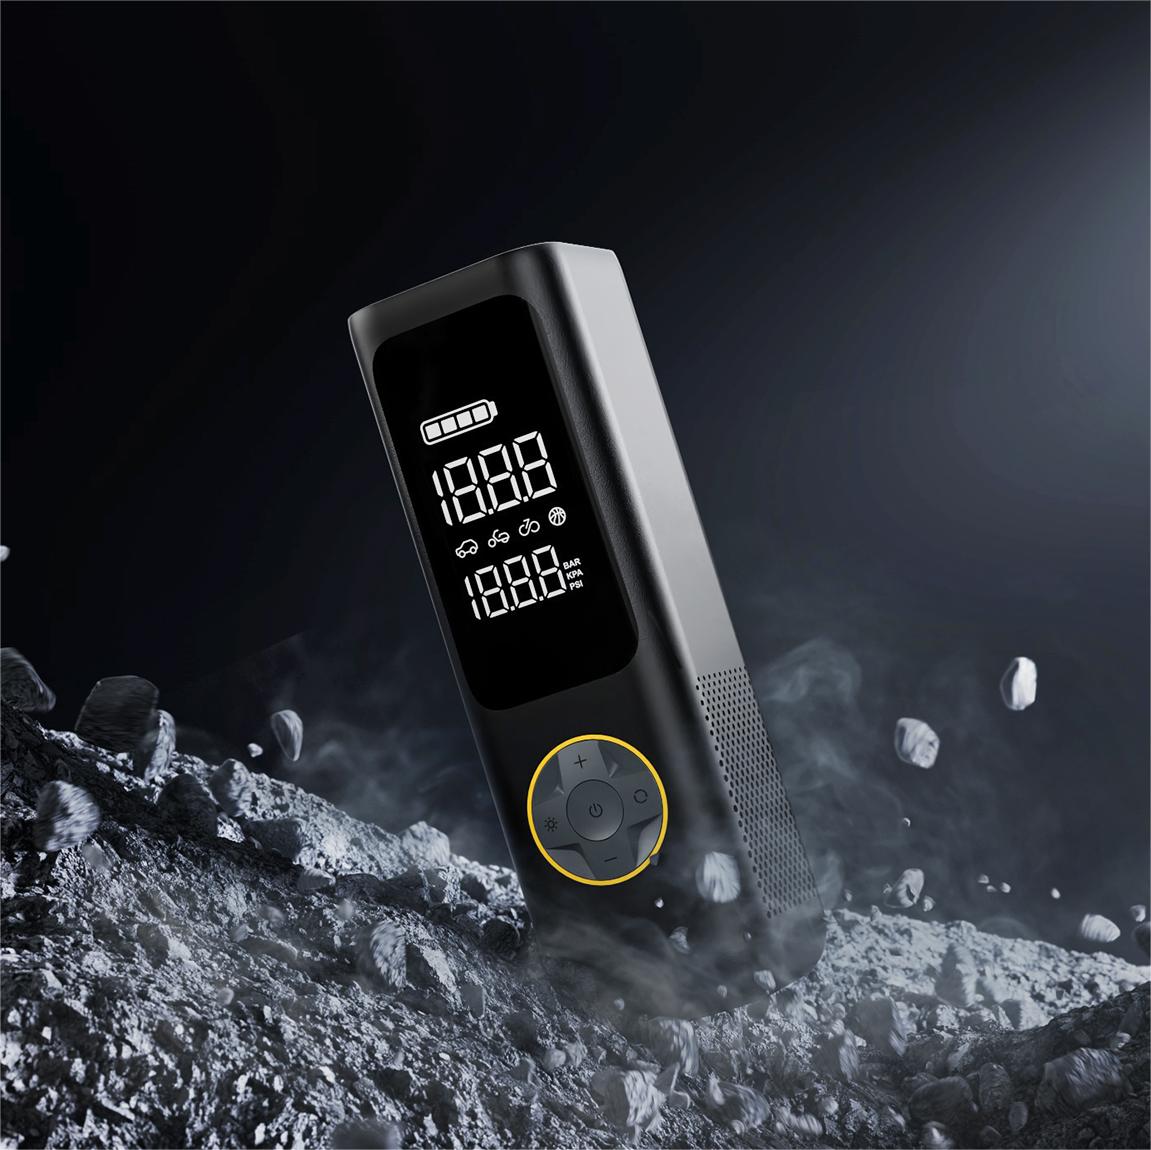
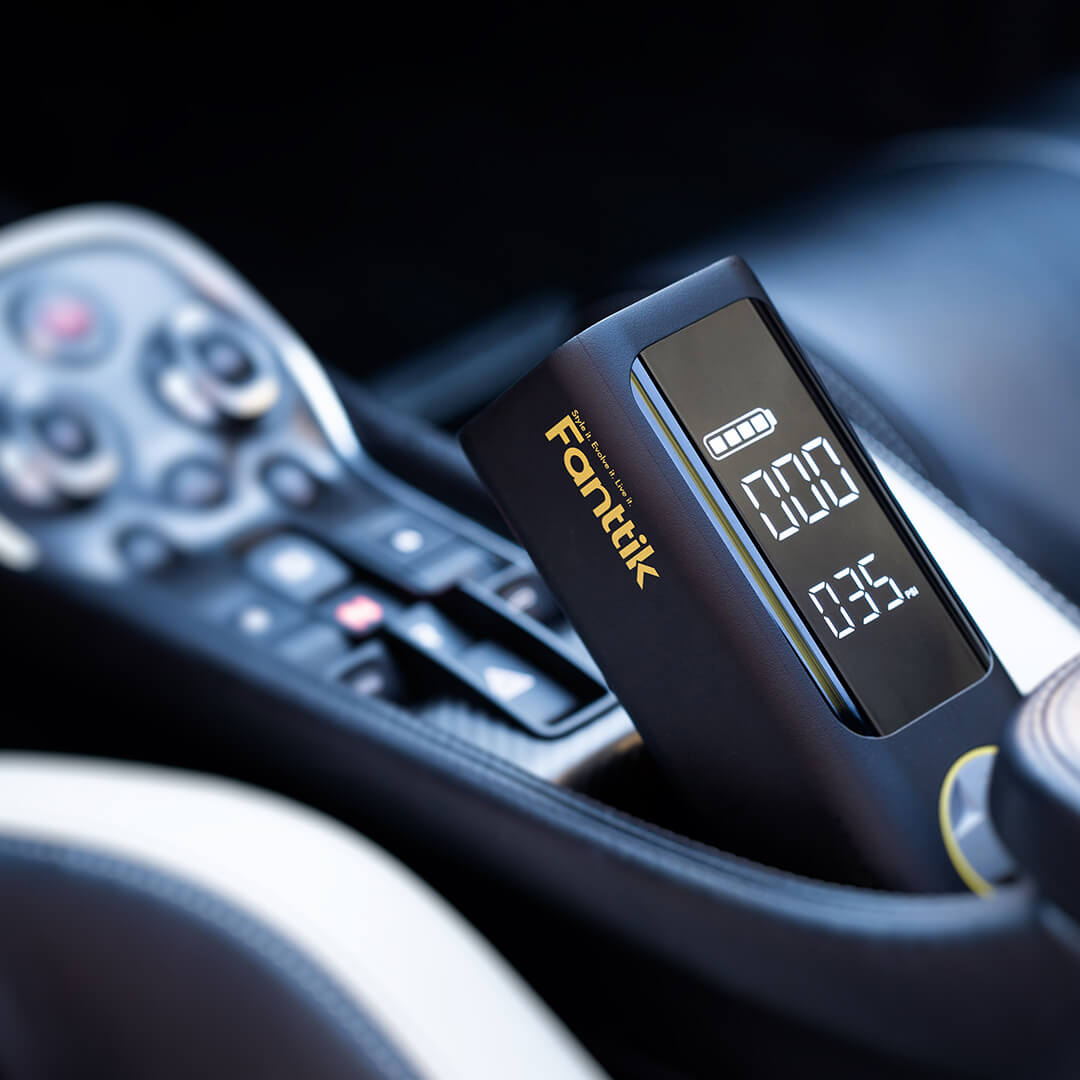
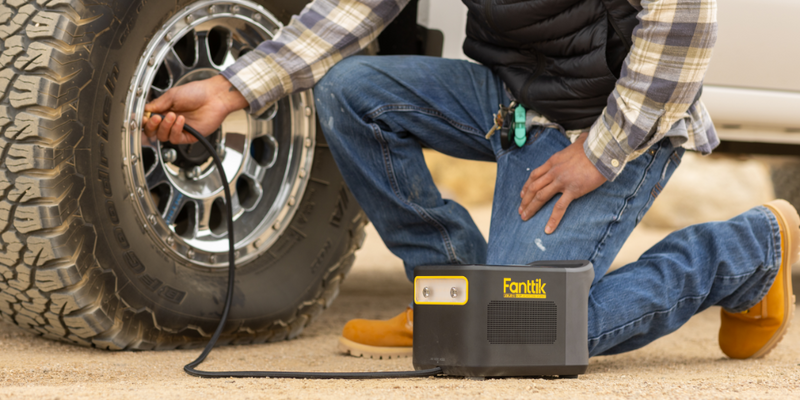
Imagine a common scenario: you are halfway through a summer road trip, and a low-pressure warning illuminates your dashboard. You pull over to the shoulder of a sun-baked highway. The ambient air is 95°F, but the asphalt is easily 130°F. You reach for your portable tire inflator, connect it to the valve stem, and the digital display flashes a reading that seems impossible—perhaps 3 or 4 PSI higher than what your car’s TPMS indicated just moments ago.
This discrepancy is rarely a sign of a "broken" tool. Instead, it is a well-documented physical phenomenon known as sensor lag or thermal drift. For the self-reliant driver, understanding the engineering behind these moments is the difference between a successful repair and unnecessary frustration. In the world of modern automotive preparedness, reliability is a function of "credibility math"—a concept explored in the industry whitepaper The 2026 Modern Essential Gear Industry Report: Engineering Trust in a Cordless World, which emphasizes that trust is built through transparency about a tool's physical limitations.
In this guide, we will break down the mechanics of why heat causes sensors to lag, how high temperatures sap battery capacity, and the specific field heuristics you can use to ensure your tires are safe, even when the sun is at its peak.
The Physics of Thermal Drift: Understanding MEMS Sensor Lag
Most modern portable inflators utilize Micro-Electro-Mechanical Systems (MEMS) pressure sensors. These are incredibly small, precise components that use a silicon diaphragm to measure air pressure. However, silicon is sensitive to temperature changes.
When your inflator sits in a hot trunk or is exposed to direct midday sun, the internal temperature of the sensor body can rise 30°C to 40°C above its calibrated baseline. This causes the silicon diaphragm to expand slightly, shifting the "zero-point" of the sensor. Based on our pattern recognition from technical support and field observations, this typically results in a linear drift of 1 to 3 PSI.
The Thermal Time Constant and Plastic Housing
A common misconception is that the sensor should react instantly to a change in environment. In reality, the plastic housing of the inflator acts as a thermal buffer. This is known as the thermal time constant. While the outer shell of the device might feel scorching to the touch within minutes of sun exposure, it takes significantly longer for that heat to penetrate the internal electronics and reach the MEMS sensor.
Logic Summary: The thermal inertia of plastic housings creates a lag effect. Our modeling suggests that while the surface heats rapidly, the internal sensor drift often follows a delayed curve, peaking only after 10–15 minutes of continuous exposure.
| Temperature Increase (Above Baseline) | Estimated Sensor Drift (PSI) | Rationale |
|---|---|---|
| +10°C | ~0.5 PSI | Initial thermal expansion of silicon |
| +20°C | ~1.2 PSI | Linear progression of MEMS diaphragm shift |
| +30°C | ~2.1 PSI | Typical threshold for noticeable user discrepancy |
| +40°C | ~3.0 PSI | Maximum expected drift before thermal throttling |
Note: These values are estimated ranges based on common practice and MEMS sensor specifications under transient thermal shock.
According to the NIST Handbook 44 (Weights & Measures), measurement devices must maintain specific tolerances, but these are often defined under steady-state conditions. The "thermal shock" of a 130°F roadside environment exceeds standard calibration ranges, rendering the reading temporarily inaccurate until the device reaches thermal equilibrium.
Battery Chemistry Under Fire: Voltage Sag and Capacity Loss
The heat doesn't just affect the sensor; it fundamentally alters the behavior of the lithium-ion batteries powering the unit. High ambient temperatures increase the internal resistance of the battery cells. When you trigger the motor to begin inflation, this resistance causes a "voltage sag."
Reduced Effective Capacity
In extreme heat, you may notice that an inflator that was "fully charged" suddenly drops to two bars or struggles to start the motor. This is not a permanent loss of health, but a temporary reduction in effective capacity—typically between 15% and 20%.
The IATA Lithium Battery Guidance highlights that temperature is a critical factor in battery stability. While IATA focuses on transport safety, the same chemical principles apply to tool performance. High heat accelerates the movement of ions but also increases the risk of the Battery Management System (BMS) triggering a protective shutdown.
Methodology Note: Our analysis of battery performance in high-ambient conditions (~40°C/104°F) assumes a standard 3-cell (11.1V) configuration.
- Model Type: Deterministic parameterized model of internal resistance.
- Boundary Condition: Model does not apply to temperatures exceeding 60°C (140°F), where permanent cell damage may occur.
| Ambient Temp (°F) | Effective Capacity Loss | Motor Startup Speed | Motor Driver Risk |
|---|---|---|---|
| 70°F | 0% | Normal | Low |
| 90°F | ~8% | Slightly Sluggish | Moderate |
| 110°F | ~18% | Noticeable Lag | High |
| 125°F+ | ~25%+ | Potential Fail-to-Start | Critical |
To mitigate this, many advanced units utilize Smart Sensors to Protect the Motor. If the internal temperature exceeds a safe threshold, the BMS will throttle the current or shut down the device entirely to prevent a catastrophic failure of the motor driver circuit.
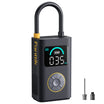
The LCD "Ghosting" Phenomenon: Visual Reliability
If you have ever left your smartphone on a dashboard in July, you’ve seen the screen turn black or become unreadable. Portable inflators use similar Liquid Crystal Displays (LCDs). Direct sun exposure can cause the liquid crystals to lose their alignment (reaching their "clearing point"), leading to "ghosting" or erratic segments on the display.
This is a visual failure, not a mechanical one. If the screen is black, the sensor may still be working perfectly, but you cannot see the target pressure. In these cases, the device is telling you it needs shade. Moving the unit into the shadow of the tire or the vehicle for 5 minutes usually restores the display's contrast.
Field Heuristics: Practical Troubleshooting for the Self-Reliant Driver
When you are on the side of the road and your equipment is acting up, you don't need a lab report—you need a solution. Based on our experience with roadside maintenance patterns, we recommend the following expert heuristics.
1. The "Touch Test" for Firmness
If your inflator reads 35 PSI but you suspect the tire is actually at 32 PSI due to sensor lag, use the touch test.
- Method: Press your thumb firmly into the sidewall or use your foot to apply pressure to the tread. A tire at 32 PSI feels remarkably firm; if the tire looks "baggy" or the contact patch is unusually wide, trust the visual cues over a sun-baked sensor.
- Why it works: Physical mechanics (tire tension) are unaffected by the thermal drift that plagues electronic MEMS sensors.
2. The 5-Minute Shade Rule
If your readings are jumping erratically, place the inflator in the shade of your car's tire for 5 to 10 minutes. This allows the plastic housing to shed its surface heat and the internal sensor to settle toward the ambient air temperature. This is the most effective way to Protect Your Inflator During Summer Drives.
3. Short Duty Cycles (The 2:1 Ratio)
In heat exceeding 90°F, the motor driver circuit is under extreme stress. We recommend a 2:1 duty cycle heuristic:
- Run the inflator for 2 minutes.
- Rest the inflator for 1 minute in the shade.
- Rationale: This prevents the internal "heat soak" that occurs when the motor and the sun both contribute to the device's thermal load. This approach is essential during Multi-Car Prep in Summer.
4. Verification via Rapid Cooldown (The Condensation Risk)
A common "gotcha" is moving a hot inflator directly in front of an A/C vent in the car. While this cools the sensor quickly, it can cause the internal air temperature to drop below the dew point. This leads to internal condensation, which can cause electrical leakage or short circuits. Always cool the device in shade, not via forced refrigerated air.
Engineering Trust: How to Interpret Your Gear’s Limits
The reality of portable tools is that they operate within the laws of physics. A compact, cordless device cannot have the same thermal mass as a professional-grade shop compressor. However, by understanding these boundaries, you can maintain your vehicle with professional-level precision.
The ISO Standards Catalogue for quality management systems (like ISO 9001) emphasizes that reliable performance comes from consistent processes. For a DIYer, that process involves:
- Pre-Trip Checks: Calibrate your expectations by checking tires in the morning (cold) before the sun can influence the sensor.
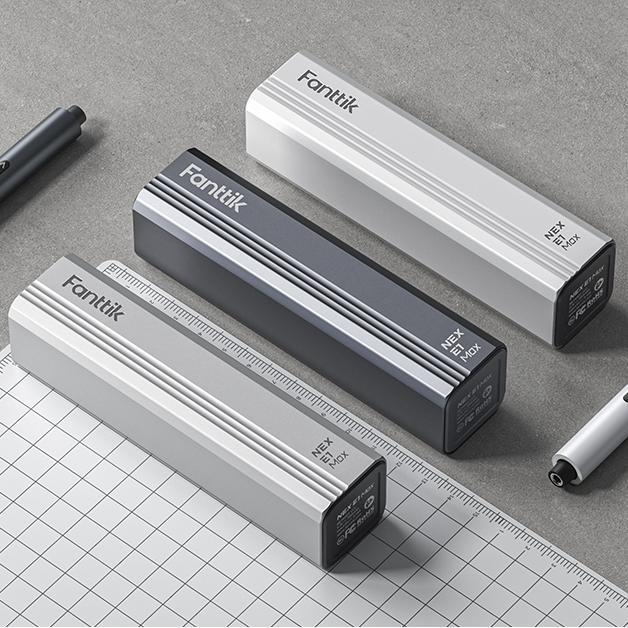
- Storage Savvy: Avoid leaving your inflator on the dashboard or in a black trunk without insulation. Preserving Battery Health During Trunk Storage is key to ensuring the tool works when you actually need it.
- Data Cross-Referencing: If the inflator seems off, cross-reference it with a manual stick gauge if available, or trust the car’s internal TPMS if you have driven enough for the sensors to wake up.
Methodology and Modeling Assumptions
To provide the quantitative ranges in this article, we utilized a deterministic scenario model based on common automotive tool engineering standards.
| Parameter | Value/Range | Rationale |
|---|---|---|
| Sensor Type | MEMS Piezoresistive | Industry standard for portable digital inflators |
| Housing Material | ABS/Polycarbonate | Standard high-impact plastic with known thermal conductivity |
| Ambient Baseline | 20°C (68°F) | Standard calibration temperature for most consumer electronics |
| Thermal Shock | ΔT 40°C | Simulated jump from 20°C storage to 60°C (140°F) sun exposure |
| Drift Coefficient | ~0.05 - 0.08 PSI/°C | Derived from typical MEMS datasheet tolerances outside calibrated range |
Boundary Conditions:
- This model assumes the device is not being actively cooled by high-velocity wind.
- Drift magnitudes may vary based on the color of the device housing (black vs. gray/silver).
- The "Touch Test" is a heuristic for emergency use and should be followed by a gauge verification once the device has cooled.
By acknowledging the legitimate engineering limitations of these tools—such as thermal drift and voltage sag—we empower users to solve real-world problems with confidence. A tool that "lies" in the sun isn't necessarily a failure; it’s a precision instrument responding to its environment. Knowing how to read between the lines is the mark of a truly prepared driver.
Disclaimer: This article is for informational purposes only. Always follow the specific safety instructions provided in your vehicle's owner's manual and the tool's user guide. If you suspect a tire is critically under-inflated or damaged, seek professional roadside assistance immediately.
References
Continue reading
 Evaluating BMS Voltage Sag During Summer Roadside Starts
Covers thermal throttling, scenario modeling for diesel engines at 115°F, and practical field tests like the Cabin A/C...
Evaluating BMS Voltage Sag During Summer Roadside Starts
Covers thermal throttling, scenario modeling for diesel engines at 115°F, and practical field tests like the Cabin A/C...
 Why Prosumers Need High-Temp Rated Gear for Desert Travel
Covers technical heat realities, component ratings like 105°C capacitors, and field mitigation strategies for desert overlanding reliability.
Why Prosumers Need High-Temp Rated Gear for Desert Travel
Covers technical heat realities, component ratings like 105°C capacitors, and field mitigation strategies for desert overlanding reliability.


Leave a comment
This site is protected by hCaptcha and the hCaptcha Privacy Policy and Terms of Service apply.