


The Criticality of Low-Pressure Accuracy
In technical rock crawling and overlanding, tire pressure is not a set-it-and-forget-it metric. It is a dynamic variable that dictates the size of your contact patch, the flexibility of your sidewall, and the ultimate limit of your traction. When we drop pressures to 10 PSI or lower to navigate "V-notches" or loose scree, the margin for error evaporates. A gauge that is "close enough" at 35 PSI can become a liability at 8 PSI.
We have observed a recurring pattern in trail-side recovery scenarios: many tire failures and "popped beads" are not the result of poor driving, but of inaccurate metrology. If your gauge reads 12 PSI when the actual pressure is 8 PSI, you are unknowingly operating in a zone where the mechanical bond between the tire bead and the wheel rim is dangerously compromised. Conversely, if it reads 8 PSI when you are actually at 12 PSI, you are leaving significant traction on the table.
Understanding the physics of why gauges fail at low pressures—and how to verify your equipment—is a foundational skill for any self-reliant off-roader. This guide breaks down the mechanical and electronic failure points of pressure measurement and establishes a methodical protocol for trail-side verification.
The Bourdon Tube Problem: Why Analog Gauges Struggle
Most mechanical tire gauges utilize a Bourdon tube—a C-shaped, flattened metal tube that tends to straighten as internal pressure increases. This movement is geared to a needle on the dial. While robust and battery-free, this design has a significant technical limitation known as "bottom-third unreliability."
Mechanical Resistance and Spring Tension
At the lower end of a gauge's range, the internal spring tension required to return the needle to zero acts as a significant counter-force. For a standard 0–60 PSI gauge, the mechanical components are often calibrated for peak accuracy in the middle 50% of the scale (30 PSI).
Based on our shop observations and comparative modeling against calibrated masters, analog gauges using Bourdon tubes consistently read 2–3 PSI high at pressures below 15 PSI. This occurs because the internal friction and spring tension of the movement are not perfectly linear. The force required to move the needle from 0 to 5 PSI is proportionally higher than the force required to move it from 30 to 35 PSI.
Logic Summary: Mechanical Nonlinearity Model
- Assumption: Standard Grade B gauge (±2% accuracy in middle half, ±3% elsewhere).
- Mechanism: Friction/stiction in the gear train and non-linear spring rate of the Bourdon tube at low deflection.
- Observed Effect: A "static offset" where the gauge requires a minimum threshold of pressure just to overcome internal inertia, leading to inflated readings at the bottom of the scale.
The 0–30 PSI Heuristic
Experienced technical crawlers often carry a dedicated, high-accuracy 0–30 PSI gauge specifically for air-down duties. By narrowing the full-scale (FS) range, the error as a percentage of the reading is significantly reduced. According to NIST Handbook 44 (Weights & Measures), measurement tolerances are often defined by the device's capacity. Using a 0–100 PSI gauge to measure 10 PSI is a violation of basic metrological principles; you are operating too close to the device's "noise floor."
Digital Drift: The Impact of Voltage and Temperature
Digital gauges and portable inflators rely on piezoelectric sensors or strain gauges that convert mechanical pressure into an electrical signal. While generally more precise than analog tubes, they are susceptible to "reference drift."
Voltage Reference and Battery Health
The internal Analog-to-Digital Converter (ADC) in a digital gauge compares the sensor's output voltage against a reference voltage. If the battery is low, this reference voltage can fluctuate. We have found that a low battery can cause a sensor reference voltage drift, leading to errors of ±1.5 PSI or more. This is particularly insidious because the display remains bright and legible, giving the user a false sense of security while the underlying calculation is flawed.
Thermal Coefficients
Pressure sensors are also sensitive to temperature. In an overlanding context, a gauge stored in a black gear box in 100°F (38°C) heat will likely provide a different reading than one used in sub-freezing morning temperatures. High-quality digital units include thermal compensation circuits, but budget-grade sensors often ignore this, leading to a "zero-point shift" as the ambient temperature changes.
Logic Summary: Digital Error Modeling
- Assumption: Piezoelectric sensor with a 0.5% Thermal Coefficient of Offset (TCO).
- Mechanism: Temperature-induced expansion of the sensor substrate and voltage drop across the lithium-ion cell under load.
- Practical Impact: An uncompensated shift of ~1 PSI for every 20°F (11°C) deviation from the calibration temperature (typically 68°F/20°C).

Field Verification Protocols: The "Zero Test" and Hysteresis
In the field, you cannot rely on laboratory-grade calibration. Instead, you must adopt a "Master Gauge" strategy, as discussed in The 2026 Modern Essential Gear Industry Report. This involves designating one high-quality, protected gauge as your "Source of Truth" and verifying all other equipment against it.
1. The Zero Test
Before every trip, perform a simple "zero test." Disconnect the gauge and ensure it reads exactly 0.0 PSI (or the needle rests perfectly on the zero pin). Any offset at atmospheric pressure is a baseline correction that must be applied to all subsequent readings. If your gauge reads 1.5 PSI when disconnected, and 11.5 PSI on the tire, your actual pressure is approximately 10.0 PSI.
2. Comparison Against the Master
If you are traveling in a group, compare readings across three different gauges. If two high-quality digital gauges agree on 12 PSI, but an analog gauge on a compressor reads 15 PSI, you have identified a 3 PSI positive offset in the compressor gauge. Note this offset with a piece of tape on the device for quick reference during the trip.
3. Hysteresis Testing
Hysteresis is the difference in a gauge's reading depending on whether the pressure is increasing or decreasing. This is a defined part of gauge verification according to ISO Standards.
- The Test: Air a tire down to 10 PSI and take a reading. Then, air it up to 20 PSI and back down to 10 PSI.
- The Result: If the second reading is 11 PSI, your gauge has a 1 PSI hysteresis error. This is common in mechanical gauges where the gears may "bind" slightly when moving in one direction versus the other.
| Verification Method | Primary Target | Trail-Side Tooling |
|---|---|---|
| Zero Test | Atmospheric Offset | Visual Check (Disconnected) |
| Master Comparison | Absolute Accuracy | 0-30 PSI Reference Gauge |
| Hysteresis Check | Repeatability | Step-down/Step-up cycles |
| Voltage Check | Sensor Reference | Battery Indicator / Multimeter |
Environmental Resilience and Failure Points
The trail environment is hostile to precision instruments. Dust, vibration, and moisture are the primary enemies of gauge longevity.
The Schrader Valve Core Failure
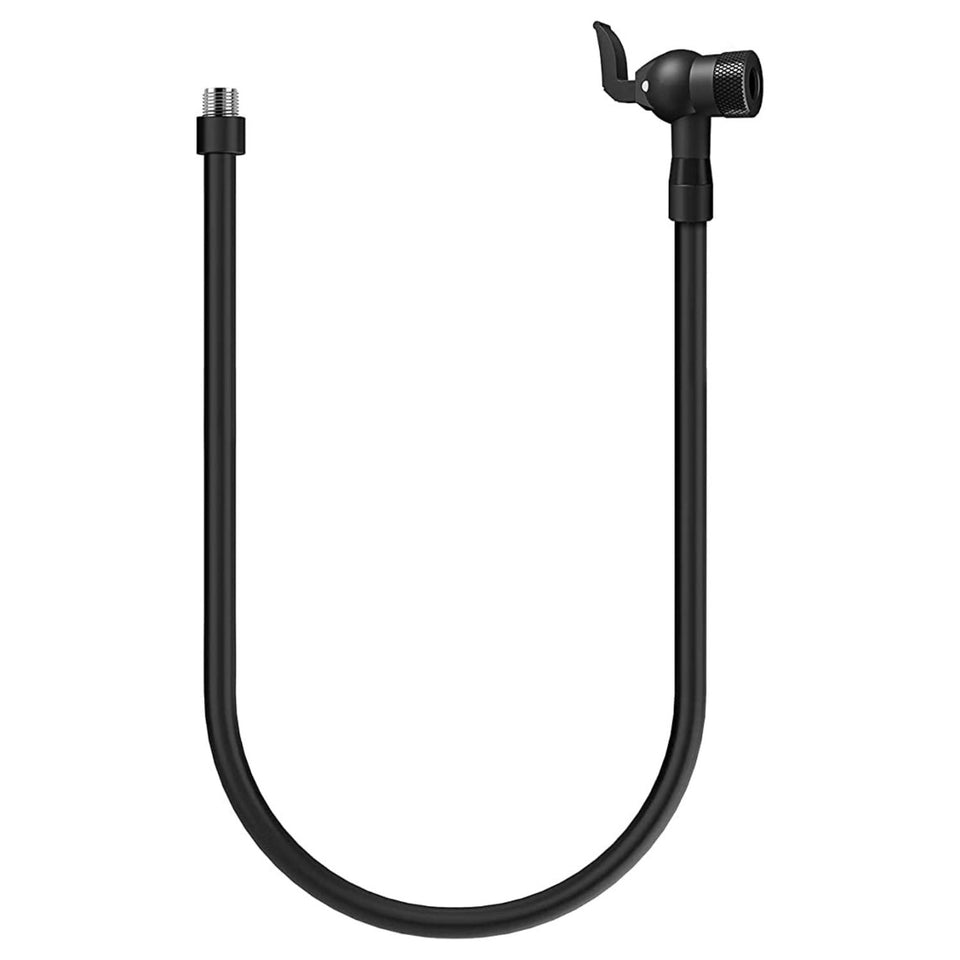
In dusty environments, the Schrader valve core on the gauge's chuck itself can become a failure point. Fine silt (caliche or "moon dust") can migrate into the valve seat, causing a slow leak during the measurement process. This leads to a "creeping" reading where the pressure appears to drop as you watch the dial. We have seen many enthusiasts lose significant pressure overnight simply because a dirty gauge chuck partially depressed the tire's valve core and didn't seal correctly, a lesson often learned the hard way at 3:00 AM in a remote campsite.
Vibration and Mechanical Shift
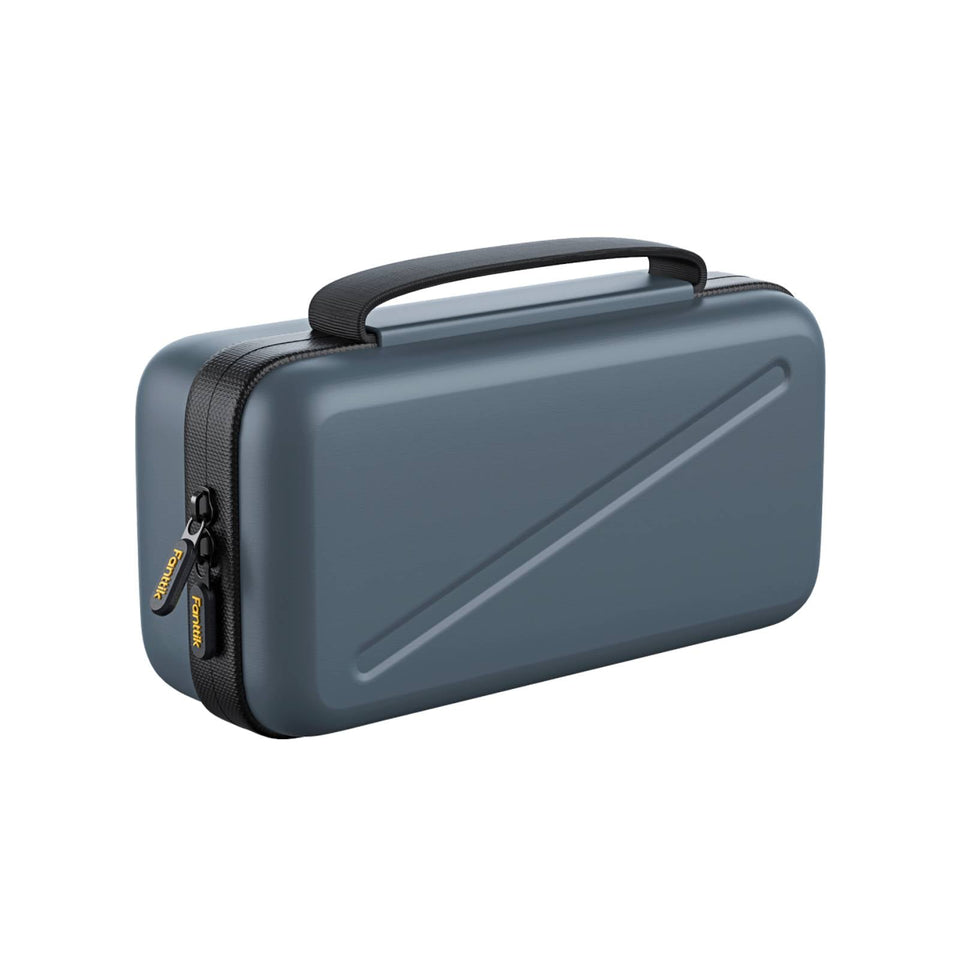
Analog gauges are particularly sensitive to the constant "washboard" vibration of dirt roads. This vibration can cause the Bourdon tube to fatigue or the needle to shift on its spindle. Storing your gauges in a padded, hard-shell case is not an aesthetic choice; it is a metrological necessity to maintain the integrity of the mechanical calibration.
Summary of Modeling and Assumptions
To provide these technical estimates, we utilized a deterministic performance model based on standard automotive sensor specifications.
| Parameter | Value / Range | Unit | Rationale |
|---|---|---|---|
| Analog FS Range | 0 - 60 | PSI | Standard off-road gauge baseline |
| Low-End Error | 2 - 3 | PSI | Observed Bourdon tube nonlinearity <15 PSI |
| Digital Drift | ±1.5 | PSI | Typical 8-bit ADC reference fluctuation at <20% battery |
| Thermal Shift | ~1.0 | PSI / 20°F | Heuristic based on uncompensated piezo-resistive sensors |
| Hysteresis Tolerance | <0.5 | PSI | Target for high-performance trail gauges |
Boundary Conditions for the Model
- Altitudinal Variance: These models assume gauge pressure (relative to ambient). Absolute pressure readings would vary significantly at high altitudes (e.g., crossing 10,000 ft passes), though the relative differential for tire performance remains the standard metric.
- Sensor Grade: Estimates assume "Prosumer" grade equipment (±1–2% FS). Laboratory-grade equipment (±0.1%) will not exhibit these errors but is rarely practical for trail use.
- Battery Chemistry: Digital drift estimates are based on Lithium-Ion discharge curves; Alkaline-based gauges may exhibit sharper drift as voltage drops.
Establishing Your Trail Metrology Routine
Precision is the byproduct of discipline. To ensure your low-pressure settings are accurate, adopt the following three-step routine:
- Designate a Reference: Invest in one high-quality, digital 0–30 or 0–60 PSI gauge. Keep it in a protective case and use it only for verification, not for daily checks.
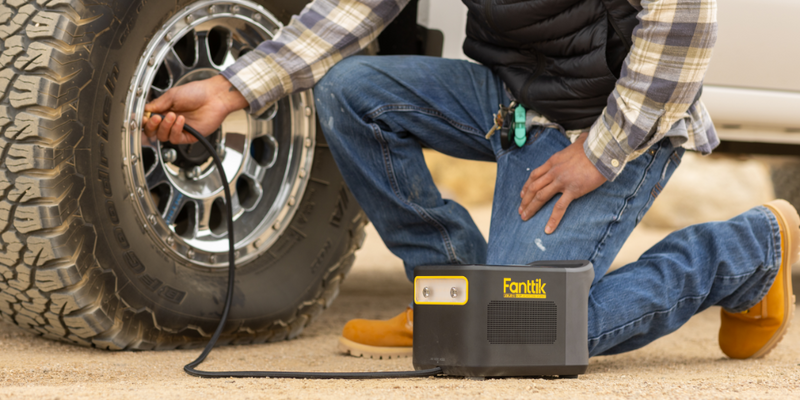
- Verify the Inflator: Most portable compressors have integrated gauges that are notoriously inaccurate due to the heat generated by the pump. Always verify the final pressure with your reference gauge after the tire has had a minute to "settle" and the air temperature inside the tire has stabilized.
- Clean the Chuck: Before connecting any gauge to a tire, blow out the chuck and the tire's valve stem with a quick burst of compressed air. This prevents trail dust from entering the gauge's sensitive internal mechanisms.
By treating tire pressure as a technical measurement rather than a guess, you significantly reduce the risk of bead failure and maximize the mechanical advantage of your vehicle's tires. In the backcountry, self-reliance starts with the tools you trust—and that trust must be verified.
Disclaimer: This article is for informational purposes only. Tire pressure requirements vary by vehicle weight, tire construction, and terrain. Always consult your tire manufacturer’s load-inflation tables and perform a "chalk test" to determine the optimal footprint for your specific rig. Fanttik is not responsible for equipment failure or accidents resulting from improper tire pressure management.
References
- NIST Handbook 44: Specifications, Tolerances, and Other Technical Requirements for Weighing and Measuring Devices
- The 2026 Modern Essential Gear Industry Report: Engineering Trust in a Cordless World
- ISO 9001: Quality Management Systems - Requirements
- Wikipedia: Pressure Measurement - Gauge Pressure vs. Absolute Pressure
- ISOBudgets: How to Calculate Hysteresis for Your Uncertainty Budget
Continue reading
 High-Flow Needs: Selecting Inflators for 35-Inch Off-Road Tires
Covers the 1.5 CFM rule, impact of cold on lithium batteries, and hardware choices like brass chucks for...
High-Flow Needs: Selecting Inflators for 35-Inch Off-Road Tires
Covers the 1.5 CFM rule, impact of cold on lithium batteries, and hardware choices like brass chucks for...
 Sidewall Flex Physics: Understanding Puncture Risks at Low PSI
A guide to sidewall flex physics and calculating safe trail tire pressure to prevent pinch punctures and heat...
Sidewall Flex Physics: Understanding Puncture Risks at Low PSI
A guide to sidewall flex physics and calculating safe trail tire pressure to prevent pinch punctures and heat...

Leave a comment
This site is protected by hCaptcha and the hCaptcha Privacy Policy and Terms of Service apply.