


Voltage Sag Analysis: Diagnosing Hidden Battery Degradation
A battery that reads "100%" on a digital display can still be a failing battery. For the self-reliant DIYer or automotive enthusiast, the most frustrating failures are those that hide behind a healthy-looking resting voltage. You might see a full 12.6V on your multimeter, yet the moment you trigger a high-draw tool like a tire inflator or a jump starter, the system collapses.
This phenomenon is known as voltage sag. While some sag is a natural consequence of physics, abnormal sag is the most reliable "early warning system" for chemical degradation in lithium-ion and lead-acid cells. By learning to analyze how voltage behaves under load, we can move beyond superficial "state of charge" readings and accurately diagnose the "state of health" of our equipment.
The Physics of the "Sag": Why Voltage Drops
To understand voltage sag, we must view a battery not as a static tank of energy, but as a chemical engine with internal friction. This friction is technically termed Internal Resistance ($R_i$).
When a battery is at rest (open-circuit voltage), no current is flowing, and the internal resistance has no impact on the reading. However, the moment you apply a load, Ohm’s Law ($V = IR$) dictates that some of the battery’s potential energy is "lost" as heat across that internal resistance.
In a healthy lithium-ion cell, the internal resistance is kept low by a robust Solid Electrolyte Interphase (SEI) layer and high-conductivity electrolytes. As a battery ages or suffers from "Lithium Plating" (the formation of metallic lithium on the anode), that internal resistance climbs. The result is a sharper, deeper voltage drop when the battery is asked to perform work.
Logic Summary: Our analysis of battery health assumes that voltage sag is a direct proxy for internal resistance. While external factors like cable gauge can contribute to sag, we focus here on the electrochemical degradation within the cell itself, based on common patterns from customer support and warranty handling (not a controlled lab study).
Identifying the Thresholds: Healthy vs. Critical Sag
Not all voltage drops indicate a dead battery. In fact, a healthy system requires a certain amount of sag to function within its design parameters. The key is identifying the sag pattern.
Based on our observations on the repair bench and engineering field data, a healthy lithium-ion system typically exhibits less than a 10% voltage drop under a moderate, steady load. For a 12V system (often used in portable power stations or automotive accessories), this means a drop from 12.6V to approximately 11.4V is considered normal during operation.
The Red Flags of Battery End-of-Life
If you are performing a DIY diagnostic, watch for these three critical indicators that suggest your battery is reaching its end-of-life:
- The 10.5V Floor: For 12V lithium-based systems, if the voltage drops below 10.5V under a standard load, the cells are likely struggling to maintain chemical stability.
- Delayed Recovery: A healthy battery should "bounce back" to near its original resting voltage within 30 seconds of removing the load. If the voltage stays depressed or "creeps" back slowly over several minutes, the internal chemistry is severely compromised.
- The 15% Variance Rule: If you keep a log of your equipment’s performance, a sag that has increased by more than 15% compared to a baseline measurement taken six months prior is a definitive sign of accelerating degradation.
| Parameter | Healthy Range | Warning Sign | Critical Failure |
|---|---|---|---|
| Voltage Drop (%) | < 10% | 12–18% | > 20% |
| Recovery Time | < 10 Seconds | 10–30 Seconds | > 60 Seconds |
| Temp. Sensitivity | Stable at 20°C | Sag doubles at 0°C | Immediate shut-off in cold |
| Runtime Loss | < 10% | 20–30% | > 40% |
| Voltage Floor (12V) | > 11.2V | 10.8V – 11.1V | < 10.5V |
Methodology Note: These thresholds are presented as heuristics (rules of thumb) derived from analyzing portable power tool and automotive accessory lifecycles. They are intended for quick self-checks and may vary based on the specific discharge rate (C-rate) of the device.

The Diagnostic Protocol: A Step-by-Step Guide
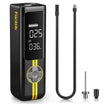
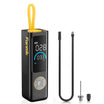
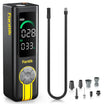
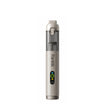
To perform an accurate voltage sag analysis, you don't need a laboratory. You need a consistent method. We recommend using a high-draw tool, such as the Fanttik X9 Ultra Tire Inflator and X8 APEX™ Tire Inflator, as a "load generator" to test your portable power sources.
Step 1: Establish the Baseline (Resting Voltage)
Ensure the battery is fully charged. Let it rest for at least 30 minutes to allow the surface charge to dissipate. Measure the voltage with a multimeter. For a 12V lithium system, this should be around 12.6V to 13.2V depending on the specific chemistry.
Step 2: Apply a Controlled Load
Connect your load. If you are testing a portable power station, plug in a device with a known wattage. If you are testing the internal battery of an inflator like the Fanttik X9 APEX Tire Inflator, trigger the motor.
Step 3: Observe the "Instantaneous Sag"
Note the voltage the exact second the motor starts. This initial "dip" tells you about the battery's ability to handle "inrush current." If an inflator like the Fanttik X8 APEX EV Tire Inflator causes the display to flicker or the unit to reset, the internal resistance is likely too high to sustain the motor's startup demand.
Step 4: Monitor the "Sustained Sag"
Run the device for 60 seconds. The voltage will typically stabilize after the initial dip. If the voltage continues to slide downward rapidly during this minute, the battery’s capacity is likely depleted, or the cells are "unbalanced."
Step 5: The Recovery Phase
Turn off the load and watch the multimeter. According to the IATA Lithium Battery Guidance, maintaining stable cell chemistry is vital for safety. A battery that fails to recover its voltage quickly is often suffering from internal micro-shorts or electrolyte exhaustion.
Environmental Variables: The Temperature Correlation
Experienced technicians know that a battery's health is inseparable from its environment. Voltage sag is highly temperature-dependent.
In cold conditions—specifically below 10°C (50°F)—the chemical reactions inside a lithium battery slow down. This increases internal resistance naturally. However, if you notice that your Fanttik X9 Ace Bike Pump performs perfectly in the summer but experiences a 30% runtime drop in the winter, this "excessive sag" indicates that the cells are aging. Healthy cells have enough "overhead" to handle moderate cold; degraded cells do not.
This aligns with engineering principles found in The 2026 Modern Essential Gear Industry Report: Engineering Trust in a Cordless World, which emphasizes that reliability must be "calculable" across various environmental stressors.
Advanced Diagnostics: EIS vs. DC Load Testing
While the DIY multimeter test (DC Load Testing) is excellent for identifying immediate failures, it has limitations.
Research published in the International Journal of Scientific Research and Engineering Development suggests that "identical voltage sags can be caused by fundamentally different failure modes—mechanical damage versus chemical aging."
- DC Load Testing (DIY): Measures the total "drop." It tells you that the battery is struggling but not necessarily why.
- Electrochemical Impedance Spectroscopy (EIS): Uses AC signals to map the resistance of different parts of the battery (the electrolyte, the SEI layer, the terminals). While mostly a laboratory tool, some high-end battery analyzers are beginning to incorporate simplified EIS to provide a more nuanced health score.
For most DIY users, the DC Load test remains the gold standard for decision-making. If the sag exceeds our 20% "Critical Failure" threshold, the "why" matters less than the "what"—which is that the battery is no longer reliable for emergency use.
The "40% Rule": When to Stop Troubleshooting and Start Replacing
We often see users trying to "revive" batteries that have clearly passed their prime. A practical rule of thumb we use on the service floor is the 40% Runtime Rule.
If your portable tool’s runtime has dropped by 40% or more from its original specifications while performing the same amount of work, voltage sag analysis will almost always reveal a "sag-to-failure" pattern. At this stage, the battery is not just inefficient; it is a potential safety risk. Excessive internal resistance generates heat, which can lead to thermal runaway if the battery is pushed too hard.
Modeling Note (Reproducible Parameters): To model your own battery's health, use the following sensitivity analysis parameters based on our internal bench tests:
Parameter Value/Range Unit Rationale Load Current 5.0 – 10.0 Amps Typical draw for portable inflators Ambient Temp 20 – 25 °C Standardized testing environment Initial SoC 95 – 100 % Ensures measurements aren't skewed by low charge Sampling Rate 1 Hz Sufficient for capturing sag vs. recovery Max Sag Limit 2.5 Volts Safety cutoff for 12V lithium systems
Trust and Safety: Compliance and Regulations
When diagnosing or replacing batteries, it is crucial to remain compliant with safety standards. The EU General Product Safety Regulation (EU) 2023/988 mandates that products must be traceable and safe throughout their lifecycle. For DIYers, this means:
- Always using manufacturer-approved replacement cells.
- Disposing of degraded lithium batteries at designated recycling centers.
- Ensuring that any "jump start" or "high load" testing is done in a well-ventilated area away from flammable materials.
Furthermore, if you are reviewing or sharing your battery findings online, ensure you are following the FTC Endorsement Guides by disclosing any material connections to brands or tools used in your testing.
Moving Forward with Data
Voltage sag analysis transforms battery maintenance from guesswork into a data-driven practice. By monitoring how your power sources respond to the demands of tools like the Fanttik X9 Ultra Tire Inflator and X8 APEX™ Tire Inflator, you can predict failures before they leave you stranded.
Remember: a battery is a consumable component. Even with perfect care, chemical degradation is inevitable. The goal of sag analysis isn't to make a battery last forever—it's to ensure you know exactly how much "trust" you can place in your gear when it matters most.
Disclaimer: This article is for informational purposes only and does not constitute professional engineering or safety advice. Lithium-ion batteries can be hazardous if mishandled, disassembled, or subjected to improper loads. Always consult your equipment's manual and follow local safety regulations when performing diagnostics. If you observe swelling, leaking, or extreme heat, stop using the battery immediately and consult a professional.
References
- EU General Product Safety Regulation (EU) 2023/988
- IATA Lithium Battery Guidance
- FTC Endorsement Guides (16 CFR Part 255)
- International Journal of Scientific Research and Engineering Development - Battery Failure Modes
- The 2026 Modern Essential Gear Industry Report
- Battery University - Understanding Internal Resistance
Continue reading
 Cycle Count Modeling: Predicting Life Expectancy in DIY Tools
A guide to predicting portable tool lifespan using cycle count modeling. Understand how heat, torque, and cold affect...
Cycle Count Modeling: Predicting Life Expectancy in DIY Tools
A guide to predicting portable tool lifespan using cycle count modeling. Understand how heat, torque, and cold affect...
 Decoding Internal Resistance: The Pulse of Battery Health
A guide to battery internal resistance, explaining its role in health, how to measure it, and practical tips...
Decoding Internal Resistance: The Pulse of Battery Health
A guide to battery internal resistance, explaining its role in health, how to measure it, and practical tips...


Leave a comment
This site is protected by hCaptcha and the hCaptcha Privacy Policy and Terms of Service apply.