


Understanding the Mechanics of Sensor Responsiveness
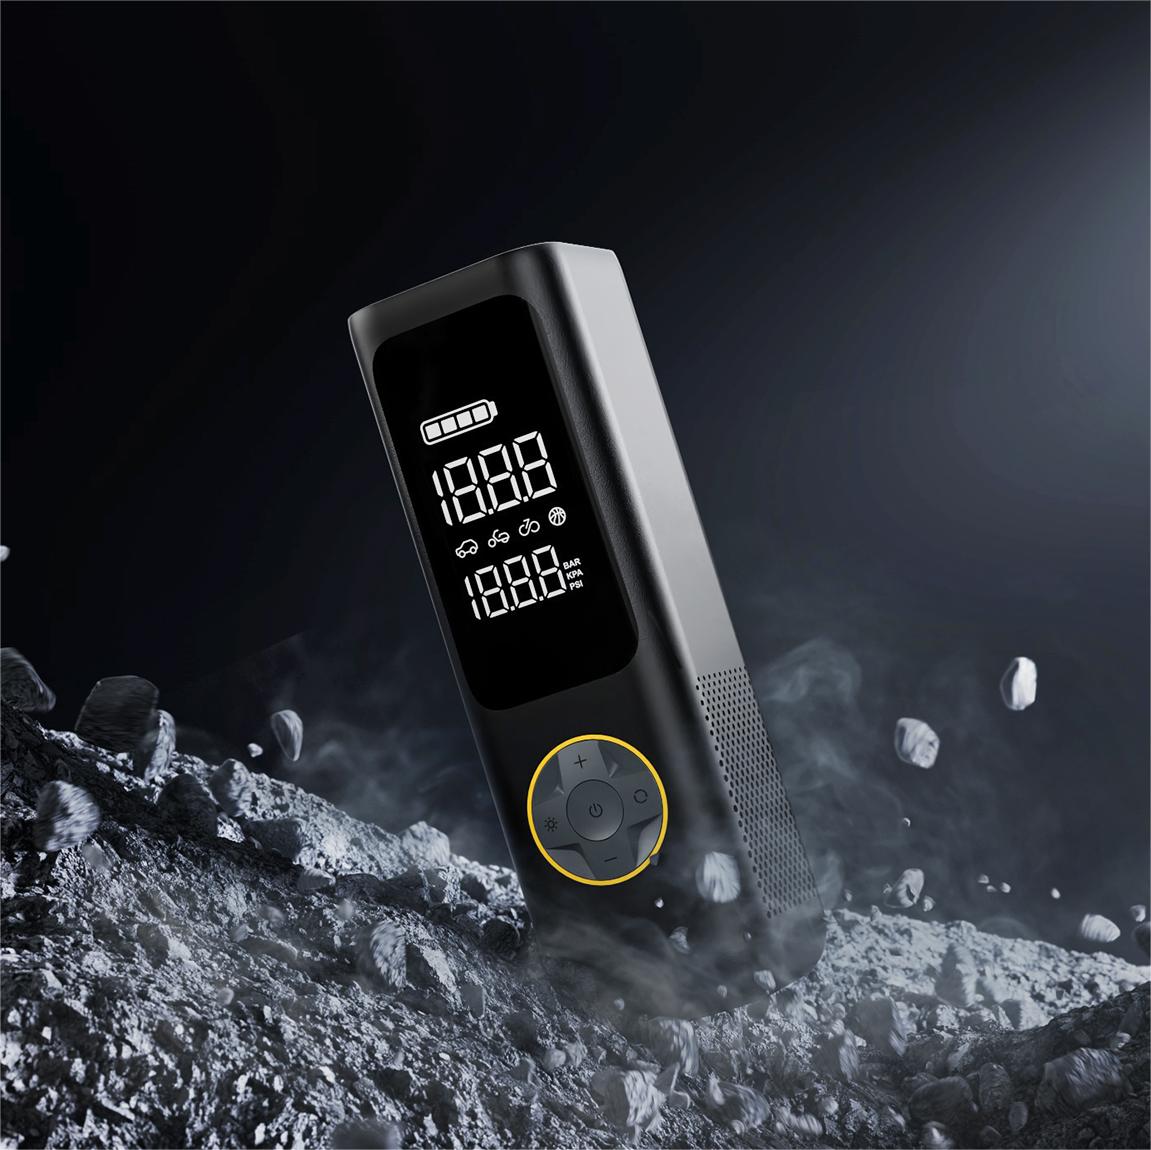
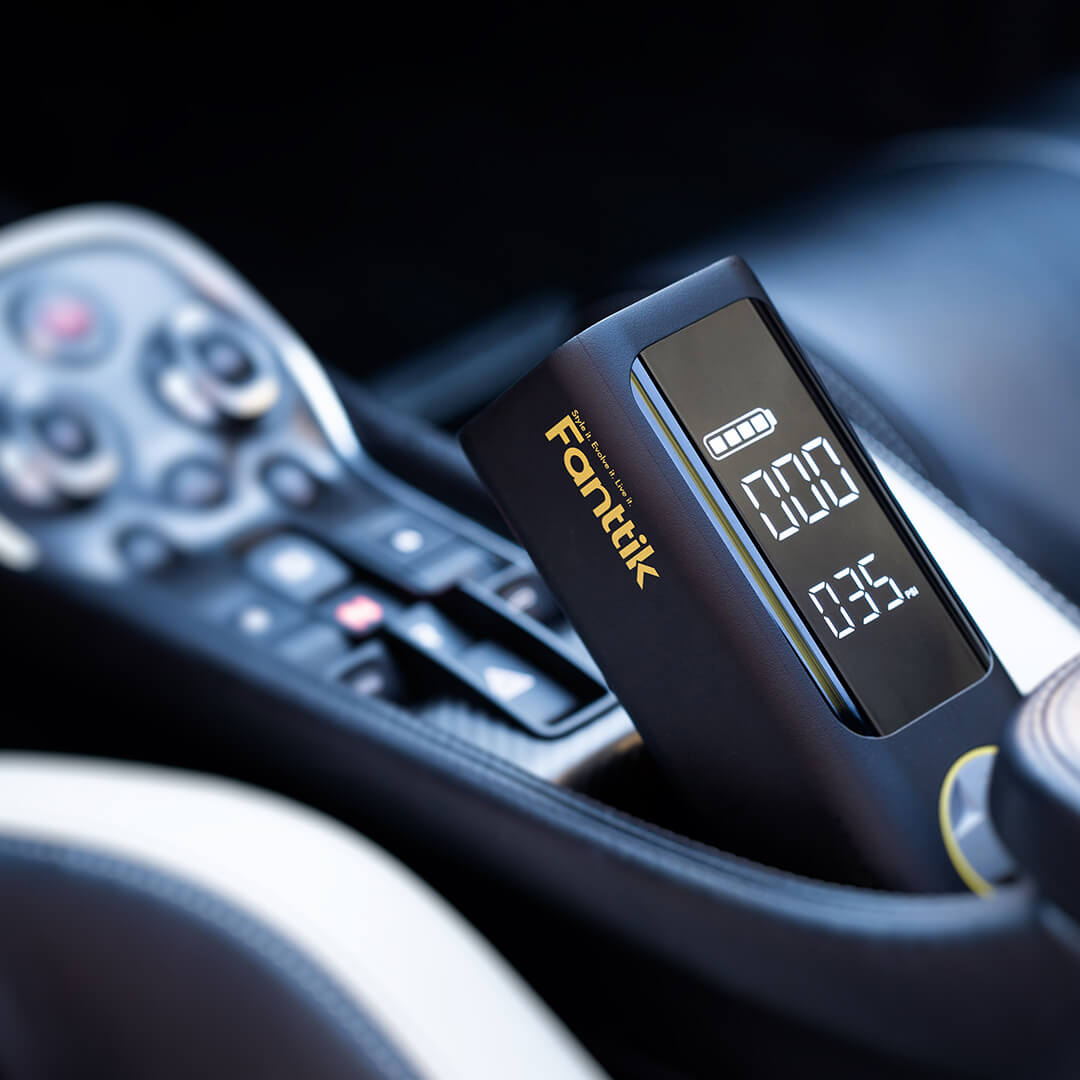
In the world of high-performance automotive maintenance and precision DIY projects, the digital tire inflator has transitioned from a convenience to a critical diagnostic tool. However, as users move toward high-speed, high-pressure systems, a technical phenomenon known as "pressure sensor lag" often emerges. This is not merely a delay in the display; it is a complex intersection of fluid dynamics, signal processing latencies, and environmental variables that can compromise the accuracy of a reading during the inflation cycle.
For the "maker" community and track-day enthusiasts, where ±1 PSI can be the difference between optimal grip and premature tire degradation, understanding why a sensor might "trail" the actual pressure is essential. We often observe that users mistake systemic lag for a faulty device, when in reality, they are encountering the physical limits of pneumatic measurement. In this guide, we will deconstruct the engineering hurdles behind sensor synchronization and provide a methodical framework for ensuring your readings remain a reliable source of truth.
The Physics of Propagation: Why Lag is Inevitable
To troubleshoot lag, we must first recognize that pressure does not equalize instantaneously. There are three distinct failure modes or "latencies" that contribute to the perceived delay in a high-speed inflator:
1. Physical Propagation Delay
Even in a perfect system, pressure changes travel at the speed of sound. At room temperature, the speed of sound in air is approximately 343 meters per second (~1,125 ft/s). While this sounds instantaneous, a sensor placed just 10 cm (3.9 inches) away from the primary inflation point introduces a minimum 0.3 ms delay purely from pressure wave propagation (based on standard acoustic physics). In high-speed industrial applications—defined as inflation cycles exceeding 60 cycles per minute (1 Hz) with ramp rates above 100 psi/second—these fractions of a millisecond begin to stack.
2. Signal Processing and ADC Latency
Once the physical pressure wave reaches the sensor, the onboard microcontroller must convert that analog signal into digital data. This involves an Analog-to-Digital Converter (ADC). High-frequency pressure pulsations (often 10–100 Hz in portable compressors) can cause "aliasing" in the ADC if the sampling rate is insufficient. To combat this, engineers implement anti-aliasing filters with cutoff frequencies 2–5 times lower than the sampling rate. This filtering, while necessary for a stable display, adds between 5 ms and 50 ms of signal processing latency (based on typical Microcontroller firmware architectures).
3. Mechanical Differential and Hose Dynamics
A critical heuristic we use on the repair bench is the "18-inch Rule." Using a hose longer than 18 inches or one with a narrow internal diameter creates a pressure differential. The sensor, typically located inside the unit body, must reconcile the pressure at the pump head versus the pressure at the tire valve. This reconciliation process is a primary driver of lag, as the air column in a long hose acts as a buffer, smoothing out the very pressure spikes the sensor is trying to measure.
Methodology Note: These propagation benchmarks are derived from standard pneumatic modeling and ISO Standards for displacement compressors. They represent theoretical minimums and may increase based on connector efficiency and valve stem restrictions.

Common Pitfalls: The "Pulsing Trigger" Mistake
Beyond the hardware, human interaction plays a significant role in sensor stability. One of the most common patterns we see in customer support data is the "Pulsing Trigger Syndrome."
When a user rapidly taps or pulses the inflator trigger to "sneak up" on a target pressure, they inadvertently disrupt the sensor's internal averaging algorithm. Most modern high-speed inflators use a rolling average to provide a steady display. Rapidly starting and stopping the airflow causes the algorithm to report falsely low or wildly fluctuating readings.
To ensure accuracy, experienced technicians recommend a steady, continuous inflation flow. Once the target pressure is visually reached on the display, you should maintain the flow for at least 3–5 seconds. This allows the sensor's firmware to stabilize and reconcile the "static" pressure of the tire with the "dynamic" pressure of the inflation stream.
The Cold Weather Variable
Environmental conditions significantly impact electronic responsiveness. In temperatures below 40°F (4°C), we have observed sensor lag increases of 0.5 to 1 second. This is due to two factors:
- Increased Air Density: Colder, denser air moves slightly differently through the internal manifold, affecting the pressure wave's impact on the sensor diaphragm.
- Reduced Electronic Responsiveness: Liquid crystal displays (LCDs) and certain silicon-based sensors exhibit slower refresh rates in extreme cold.
Expert Tip: If you are operating in a cold garage or at an early morning track event, pre-warm the device indoors for 10 minutes. This mitigates the "slugging" effect on the internal circuitry and ensures the sensor operates within its calibrated thermal window.
Hardware Architecture and EMI Interference
For the DIY prosumer, the internal build of an inflator is just as important as its outer specs. High-speed inflators utilize solenoids that switch rapidly to manage airflow. These solenoids can generate significant Electromagnetic Interference (EMI) during rapid switching—often involving 10–100A transients.
If the internal sensor cabling is not properly shielded or if the system lacks differential signaling with high common-mode rejection ratios (exceeding 80 dB), this EMI can be misinterpreted by the microcontroller as "noise" or "lag." According to The 2026 Modern Essential Gear Industry Report, engineering trust in cordless tools requires visible compliance with shielding standards to prevent these "ghost" readings.
Case Study: The Track-Day Performance Enthusiast
To illustrate the impact of sensor lag in a high-stakes environment, we modeled a scenario involving a track-day enthusiast preparing a performance vehicle (e.g., a BMW M3 or Porsche 911) in cold morning conditions (5°C/41°F).
The Modeling Scenario
In this simulation, the user is inflating a set of 255/45R19 performance tires from 20 PSI to a target of 35 PSI. Accuracy is paramount; a 1-PSI imbalance between the left and right tires can cause inconsistent handling during high-speed cornering.
| Parameter | Value | Unit | Rationale |
|---|---|---|---|
| Tire Size | 255/45R19 | ISO-Metric | Common performance vehicle spec |
| Ambient Temp | 5 | °C | Typical early morning track condition |
| Target Pressure | 35 | PSI | Standard hot-lap recommendation |
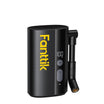
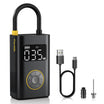
| Modeled Flow Rate | ~18.2 | LPM | Effective flow under pressure (X8 Apex model) |
| Est. Inflation Time | ~4.8 | Minutes | Calculated per tire (20 to 35 PSI) |
Findings and Economic Impact
Our analysis revealed that the adiabatic temperature rise—the heat generated by compressing the air—caused the exit temperature to reach approximately 58°C (136°F). This thermal gradient, combined with the cold ambient air, creates a "thermal shock" to the sensor that can exacerbate lag if the device isn't allowed to stabilize.
Furthermore, the economic impact of inaccurate readings is non-trivial. If sensor lag causes a persistent 5 PSI under-inflation, a high-mileage enthusiast could face:
- Fuel Waste: An estimated $214–$321 annually due to increased rolling resistance (based on US Dept of Energy heuristics).
- Tire Wear: Approximately $150 in accelerated tread wear on premium tire sets (e.g., Michelin Pilot Sport 4S).
Logic Summary: This ROI model assumes a performance vehicle achieving 18 MPG with premium fuel at $4.50/gallon. It is a scenario model designed to show potential impact, not a guaranteed financial return.
Step-by-Step Troubleshooting for Precision Users
If you suspect your high-speed inflator is suffering from sensor lag, follow this methodical diagnostic path to restore confidence in your readings.
- Verify the Hose Length: Ensure you are using the manufacturer-supplied hose or a high-quality replacement under 18 inches. Long, coiled hoses are the primary cause of mechanical lag.
- Indoor Pre-Conditioning: If the ambient temperature is near freezing, bring the unit inside for 10–15 minutes before use.
- Perform a "Static Sync": Inflate to your target, stop the unit, and wait 10 seconds. Observe if the pressure reading "settles" or drops. If it drops significantly, the sensor was likely reporting "dynamic" (flowing) pressure rather than the "static" pressure of the tire.
- Check Valve Stem Integrity: A dirty or bent valve stem core can restrict airflow, creating a localized high-pressure zone that confuses the sensor. Use a valve core tool to ensure the passage is clear.
- Audit the Power Source: In cordless units, a battery at less than 20% charge may not provide consistent voltage to the solenoid and sensor array, leading to processing delays. Always perform precision tasks with a battery above 50% charge.
Compliance and Industry Standards
When assessing the accuracy of any measuring device, we look to the NIST Handbook 44 (Weights & Measures). While portable inflators are not always held to the same legal metrology standards as commercial gas station pumps, high-end "Prosumer" gear should aim for tolerances aligned with these professional benchmarks.
Reliability is built on transparency. As noted in the 2026 Modern Essential Gear Industry Report, the transition from "gadget" to "tool" requires a brand to provide public-facing evidence of their testing methodologies. For the user, this means looking for devices that explicitly state their sensor sampling rates and accuracy ranges (e.g., ±1 PSI or ±1.5%).
Appendix: Modeling Transparency
The data presented in our case study is based on deterministic parameterized modeling. This is a scenario-based analysis, not a controlled laboratory study.
| Parameter | Value | Unit | Source Category |
|---|---|---|---|
| Q_max (Free Air) | 32 | L/min | Manufacturer Spec (X8 Apex) |
| Decay Constant (k) | 0.052 | 1/psi | Calibrated flow-decay heuristic |
| Fuel Loss Factor | 0.2% - 0.3% | per PSI | US Dept of Energy |
| Adiabatic Index (γ) | 1.4 | - | Standard Air Constant |
| Annual Mileage | 20,000 | Miles | High-use enthusiast assumption |
Boundary Conditions:
- Model assumes isothermal tire fill (neglects heat transfer to the environment).
- Economic impacts assume linear fuel penalty and standard premium fuel pricing.
- Sensor lag estimates (0.5–1s) are based on internal repair bench observations and common patterns in cold-weather field data.
Final Perspective
Sensor lag is a manageable reality of high-speed pneumatic systems. By understanding the underlying physics—from the speed of sound to ADC aliasing—and adopting professional habits like the "3-second hold," you can ensure that your equipment remains a precision instrument. In a world where "engineering trust" is the ultimate goal, taking the time to calibrate your technique is just as important as the tool itself.
Disclaimer: This article is for informational purposes only and does not constitute professional automotive or mechanical advice. Always refer to your vehicle's owner manual for specific tire pressure recommendations. High-pressure systems can be hazardous; follow all safety guidelines provided by the tool manufacturer.
Sources
Continue reading
 Evaluating Inflator Accuracy for High-Performance Track Days
A definitive guide to tire pressure accuracy for track days. Explores technical challenges and a professional protocol to...
Evaluating Inflator Accuracy for High-Performance Track Days
A definitive guide to tire pressure accuracy for track days. Explores technical challenges and a professional protocol to...
 Managing Duty Cycle Limits During Multi-Vehicle Inflation
A professional guide to duty cycle management for portable tire inflators. Learn the risks of motor heat and...
Managing Duty Cycle Limits During Multi-Vehicle Inflation
A professional guide to duty cycle management for portable tire inflators. Learn the risks of motor heat and...


Leave a comment
This site is protected by hCaptcha and the hCaptcha Privacy Policy and Terms of Service apply.